Inserting variables into pages with glue
You often wish to run analyses in one notebook and insert them into your documents text elsewhere. For example, if you’d like to include a figure, or if you want to cite a statistic that you have run.
The glue submodule allows you to add a key to variables in a notebook,
then display those variables in your book by referencing the key.
This page describes how to add keys to variables in notebooks, and how to insert them into your book’s content in a variety of ways.1
Gluing variables in your notebook
You can use myst_nb.glue() to assign value of a variable to
a key of your choice. glue will store all of the information that is normally used to display
that variable (ie, whatever happens when you display the variable by putting it at the end of a cell).
Choose a key that you will remember, as you will use it later.
The following code glues a variable inside the notebook:
from myst_nb import glue
a = "my variable!"
glue("my_variable", a)
'my variable!'
You can then insert it into your text like so: 'my variable!'.
That was accomplished with the following code: {glue:}`my_variable`.
Gluing numbers, plots, and tables
You can glue anything in your notebook and display it later with {glue:}. Here
we’ll show how to glue and paste numbers and images. We’ll simulate some
data and run a simple bootstrap on it. We’ll hide most of this process below,
to focus on the glueing part.
# Simulate some data and bootstrap the mean of the data
import numpy as np
import pandas as pd
import matplotlib.pyplot as plt

n_points = 10000
n_boots = 1000
mean, sd = (3, .2)
data = sd*np.random.randn(n_points) + mean
bootstrap_indices = np.random.randint(0, n_points, n_points*n_boots).reshape((n_boots, n_points))
In the cell below, data contains our data, and bootstrap_indices is a collection of sample indices in each bootstrap. Below we’ll calculate a few statistics of interest, and
glue() them into the notebook.
# Calculate the mean of a bunch of random samples
means = data[bootstrap_indices].mean(0)
# Calcualte the 95% confidence interval for the mean
clo, chi = np.percentile(means, [2.5, 97.5])

# Store the values in our notebook
glue("boot_mean", means.mean())
glue("boot_clo", clo)
glue("boot_chi", chi)
2.999170526384387
2.98664162917544
3.0114864783550366
By default, glue will display the value of the variable you are gluing. This
is useful for sanity-checking its value at glue-time. If you’d like to prevent display,
use the display=False option. Note that below, we also overwrite the value of
boot_chi (but using the same value):
glue("boot_chi_notdisplayed", chi, display=False)
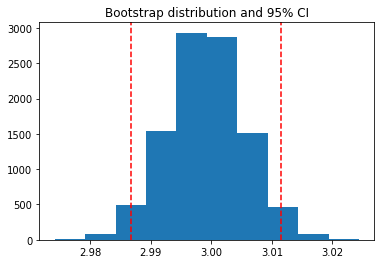
You can also glue visualizations, such as matplotlib figures (here we use display=False to ensure that the figure isn’t plotted twice):
# Visualize the historgram with the intervals
fig, ax = plt.subplots()
ax.hist(means)
for ln in [clo, chi]:
    ax.axvline(ln, ls='--', c='r')
ax.set_title("Bootstrap distribution and 95% CI")

# And a wider figure to show a timeseries
fig2, ax = plt.subplots(figsize=(6, 2))
ax.plot(np.sort(means), lw=3, c='r')
ax.set_axis_off()

glue("boot_fig", fig, display=False)
glue("sorted_means_fig", fig2, display=False)

The same can be done for DataFrames (or other table-like objects) as well.
bootstrap_subsets = data[bootstrap_indices][:3, :5].T
df = pd.DataFrame(bootstrap_subsets, columns=["first", "second", "third"])
glue("df_tbl", df)
| first | second | third | |
|---|---|---|---|
| 0 | 2.940952 | 3.035254 | 2.757364 |
| 1 | 3.289994 | 2.857253 | 3.343168 |
| 2 | 3.347079 | 3.118553 | 2.833967 |
| 3 | 3.115837 | 2.669805 | 3.125343 |
| 4 | 3.154917 | 3.026968 | 3.126113 |
Tip
Since we are going to paste this figure into our document at a later point,
you may wish to remove the output here, using the remove-output tag
(see Removing parts of cells).
Pasting glued variables into your page
Once you have glued variables into a notebook, you can then paste
those variables into your text in your book anywhere you like (even on other pages).
These variables can be pasted using one of the roles or directives in the glue: family.
The glue role/directive
The simplest role and directive are glue:any,
which paste the glued output inline or as a block respectively,
with no additional formatting.
Simply add this:
```{glue:} your-key
```
For example, we’ll paste the plot we generated above with the following text:
```{glue:} boot_fig
```
Here’s how it looks:
Or we can paste inline objects like so:
Inline text; {glue:}`boot_mean`, and figure; {glue:}`boot_fig`.
Inline text; 2.999170526384387, and figure; .
Tip
We recommend using wider, shorter figures when plotting in-line, with a ratio
around 6x2. For example, here’s is an in-line figure of sorted means
from our bootstrap: 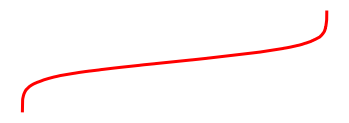 .
It can be used to make a visual point that isn’t too complex! For more
ideas, check out how sparklines are used.
.
It can be used to make a visual point that isn’t too complex! For more
ideas, check out how sparklines are used.
Next we’ll cover some more specific pasting functionality, which gives you more control over how the outputs look in your pages.
Controling the pasted outputs
You can control the pasted outputs by using a sub-command of {glue:}. These are called like so:
{glue:subcommand}`key`. These subcommands allow you to control more of the look, feel, and
content of the pasted output.
Tip
When you use {glue:} you are actually using a short-hand for {glue:any}. This is a
generic command that doesn’t make many assumptions about what you are gluing.
The glue:text role
The glue:text role, is specific to text outputs.
For example, the following text:
The mean of the bootstrapped distribution was {glue:text}`boot_mean` (95% confidence interval {glue:text}`boot_clo`/{glue:text}`boot_chi`).
Is rendered as: The mean of the bootstrapped distribution was 2.999170526384387 (95% confidence interval 2.98664162917544/3.0114864783550366)
Note
glue:text only works with glued variables that contain a text/plain output.
With glue:text we can add formatting to the output.
This is particularly useful if you are displaying numbers and
want to round the results. To add formatting, use this pattern:
{glue:text}`mykey:formatstring`
For example, the following: My rounded mean: {glue:text}`boot_mean:.2f` will be rendered like this: My rounded mean: 3.00 (95% CI: 2.99/3.01).
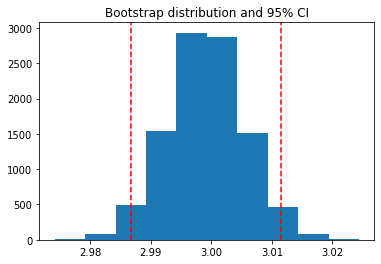
The glue:figure directive
With glue:figure you can apply more formatting to figure like objects,
such as giving them a caption and referencable label:
```{glue:figure} boot_fig
:figwidth: 300px
:name: "fig-boot"

This is a **caption**, with an embedded `{glue:text}` element: {glue:text}`boot_mean:.2f`!
```
This is a caption, with an embedded {glue:text} element: 3.00!
Here is a {ref}`reference to the figure <fig-boot>`
Here is a reference to the figure
Here’s a table:
```{glue:figure} df_tbl
:figwidth: 300px
:name: "tbl:df"

A caption for a pandas table.
```
| first | second | third | |
|---|---|---|---|
| 0 | 2.940952 | 3.035254 | 2.757364 |
| 1 | 3.289994 | 2.857253 | 3.343168 |
| 2 | 3.347079 | 3.118553 | 2.833967 |
| 3 | 3.115837 | 2.669805 | 3.125343 |
| 4 | 3.154917 | 3.026968 | 3.126113 |
A caption for a pandas table.
The glue:math directive
The glue:math directive, is specific to latex math outputs
(glued variables that contain a text/latex mimetype),
and works similarly to the sphinx math directive.
For example:
import sympy as sym
f = sym.Function('f')
y = sym.Function('y')
n = sym.symbols(r'\alpha')
f = y(n)-2*y(n-1/sym.pi)-5*y(n-2)
glue("sym_eq", sym.rsolve(f,y(n),[1,4]))
Insert the equation here:

```{glue:math} sym_eq
:label: eq-sym
```

Which we reference as Equation {eq}`eq-sym`
Insert the equation here:
Which we reference as Equation (1).
Note
glue:math only works with glued variables that contain a text/latex output.
Advanced glue usecases
Here are a few more specific and advanced uses of the glue submodule.
Pasting from pages you don’t include in the documentation
Sometimes you’d like to use variables from notebooks that are not meant to be
shown to users. In this case, you should bundle the notebook with the rest of your
content pages, but include orphan: in the metadata of the notebook.
For example, the following text: {glue:}`orphaned_var` was created in {ref}`orphaned-nb`.
Results in: 'My orphaned variable!' was created in An orphaned notebook
Pasting into tables
In addition to pasting blocks of outputs, or in-line with text, you can also paste directly into tables. This allows you to compose complex collections of structured data using outputs that were generated in other notebooks. For example the following table:
| name                            |       plot                  | mean                      | ci                                                |
|:-------------------------------:|:---------------------------:|---------------------------|---------------------------------------------------|
| histogram and raw text          | {glue:}`boot_fig`             | {glue:}`boot_mean`          | {glue:}`boot_clo`-{glue:}`boot_chi`                   |
| sorted means and formatted text | {glue:}`sorted_means_fig`     | {glue:text}`boot_mean:.3f` | {glue:text}`boot_clo:.3f`-{glue:text}`boot_chi:.3f` |
Results in:
name |
plot |
mean |
ci |
|---|---|---|---|
histogram and raw text |
|
|
|
sorted means and formatted text |
|
2.999 |
2.987-3.011 |
- 1
This notebook can be downloaded as
glue.ipynbandglue.md