Custom Notebook Formats
You can designate additional file types to be converted to Notebooks, and then executed / parsed in the same manner as regular Notebooks, by adding the following configuration to your conf.py:
nb_custom_formats = {
  ".mysuffix": "mylibrary.converter_function"
}
The string should be a Python function that will be loaded by
import mylibrary.converter_functionThe function should take a file’s contents (as a
str) and return an nbformat.NotebookNode
If the function takes additional keyword arguments, then you can specify these as dictionary in a second argument. For example this is what the default conversion would look like:
nbsphinx_custom_formats = {
    '.ipynb': ['nbformat.reads', {'as_version': 4}],
}
Important
By default, Markdown cells in the Notebook will be parsed using the same MyST parser configuration as for other Markdown files (see available configuration options).
But, if this is incompatible with your file format, then you can specify for the Markdown to be parsed as strictly CommonMark, using a third argument:
nbsphinx_custom_formats = {
    '.ipynb': ['nbformat.reads', {'as_version': 4}, True],
}
Finally, for text-based formats, MyST-NB also searches for an optional source_map key in the output Notebook’s metadata.
This key should be a list mapping each cell to the starting line number in the original source file, for example for a notebook with three cells:
{
  "metadata": {
    "source_map": [10, 21, 53]
  }
}
This mapping allows for “true” error reporting, as described in Sphinx Error Reporting.
Using Jupytext
A common conversion tool is jupytext, which has been used to convert this very .Rmd file to a notebook!
The configuration looks like:
nb_custom_formats = {
  ".Rmd": ["jupytext.reads", {"fmt": "Rmd"}]
}
Important
It is necessary to use jupytext<=1.4.0,>=1.5.0, due to an incompatibility with the myst-parser version in jupytext=1.4.
For example:
\```{python echo=TRUE}
import pandas as pd
series = pd.Series({'A':1, 'B':3, 'C':2})
pd.DataFrame({"Columne A": series})
\```
import pandas as pd
series = pd.Series({'A':1, 'B':3, 'C':2})
pd.DataFrame({"Columne A": series})
| Columne A | |
|---|---|
| A | 1 |
| B | 3 |
| C | 2 |
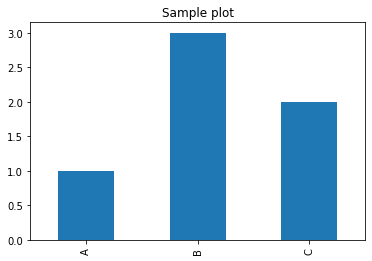
\```{python bar_plot, echo=FALSE, fig.height=5, fig.width=8}
series.plot(kind='bar', title='Sample plot')
\```
<AxesSubplot:title={'center':'Sample plot'}>